Mathematics
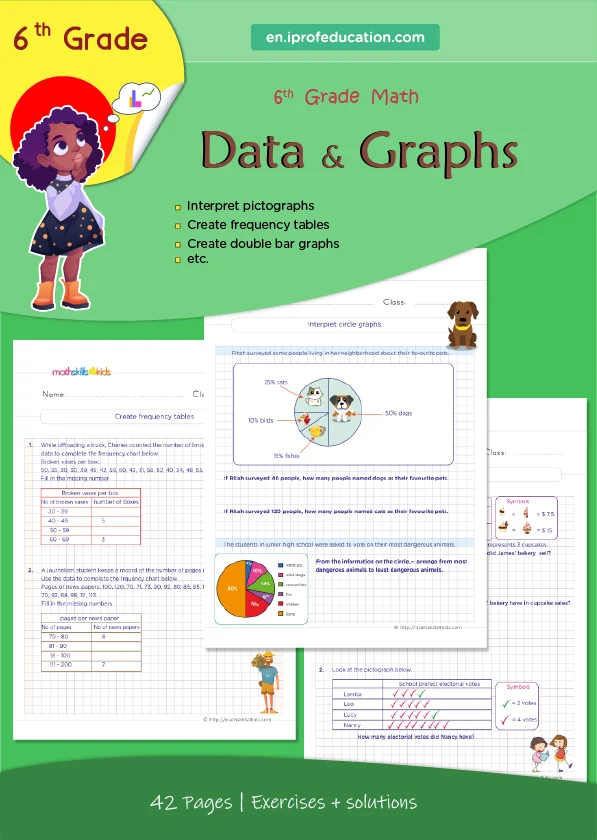
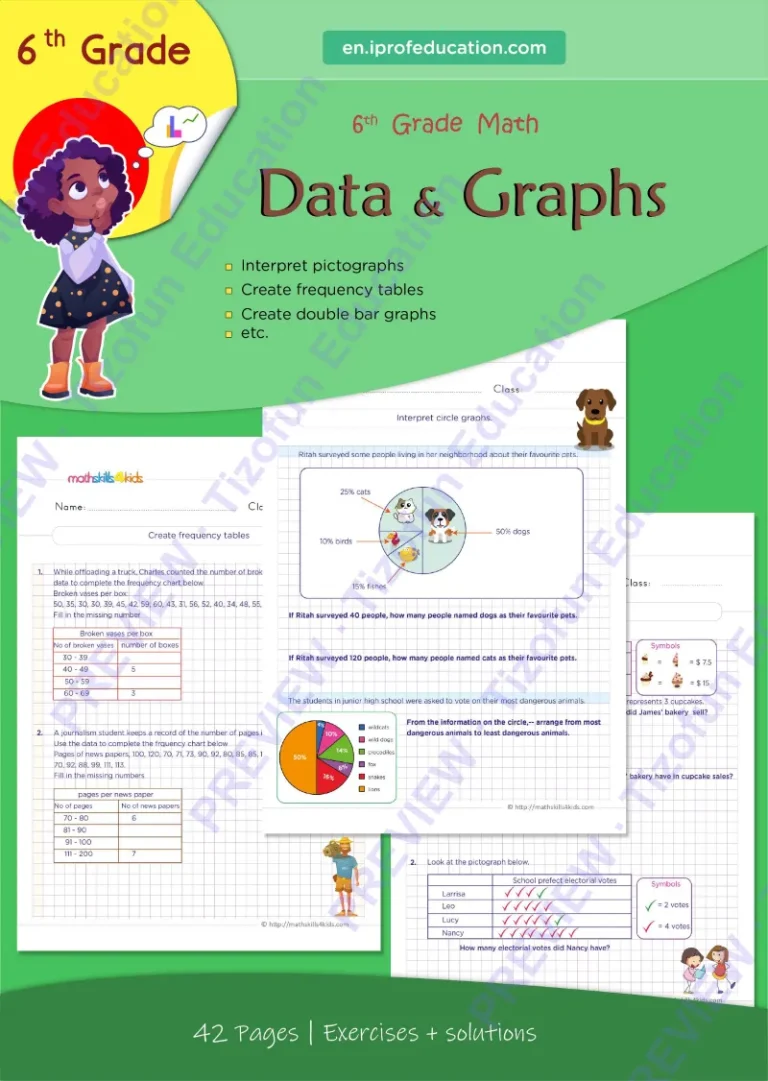
Grade 6 data and graphs: bar graphs, line plots, histograms, stem-and-leaf — 21 worksheets
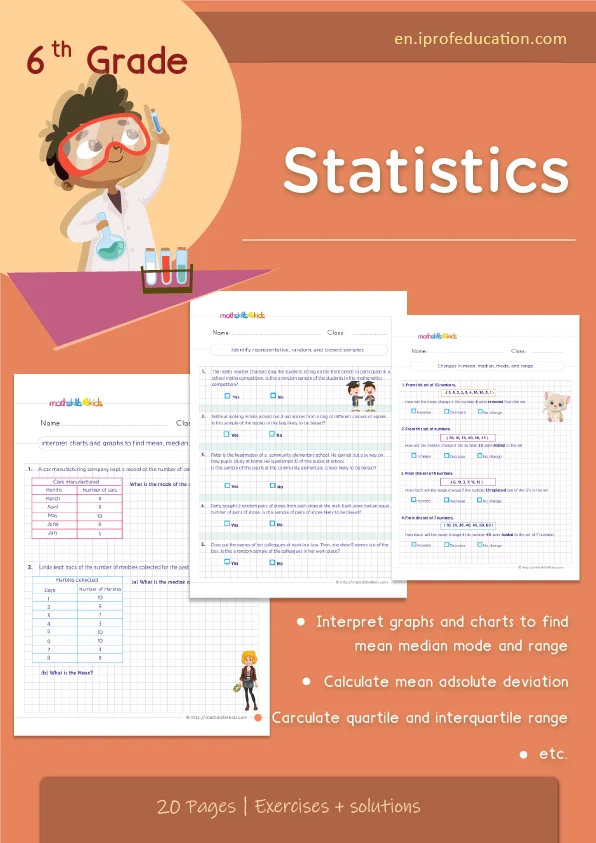
Reading and making every common kind of graph — pictographs, line plots, bar and line graphs, histograms, circle graphs, stem-and-leaf and box plots — and choosing the right one for a set of data.
At a glance: 2 printable PDFs (worksheets + answer key) · 26.0 MB · 21 worksheets + 21 answer pages · Grade 6 (US) · Year 7 (UK) · ages 11–12
Current price: 4,35 €
Description
In the pack
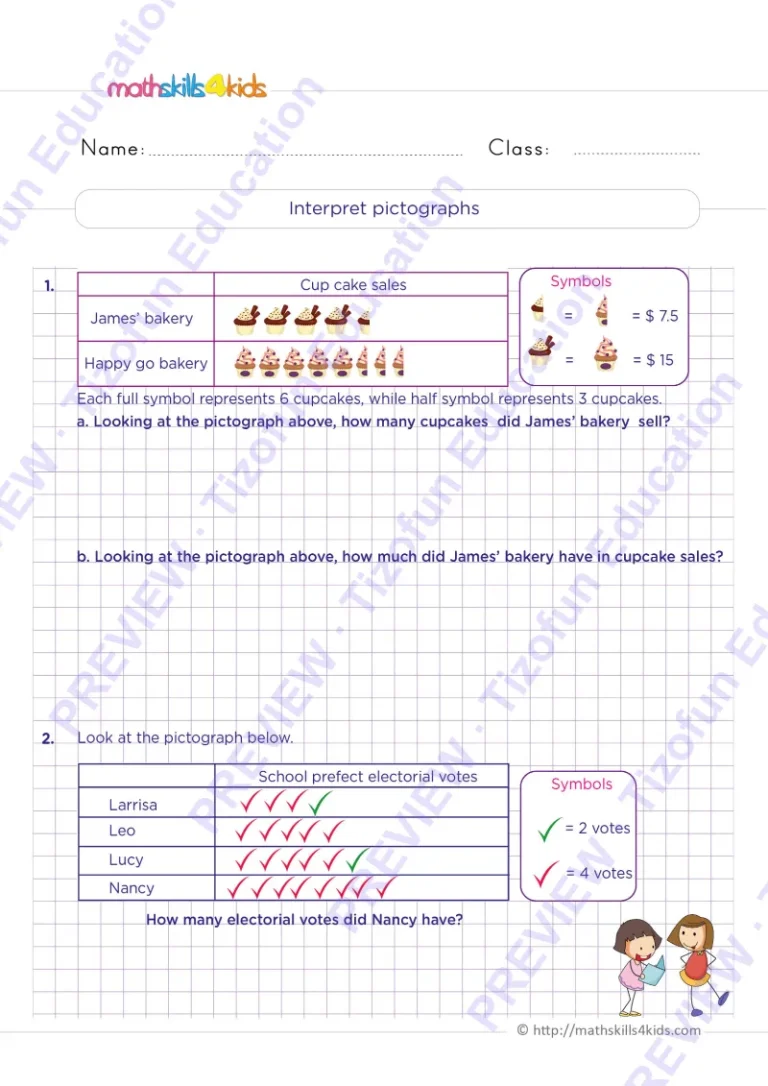
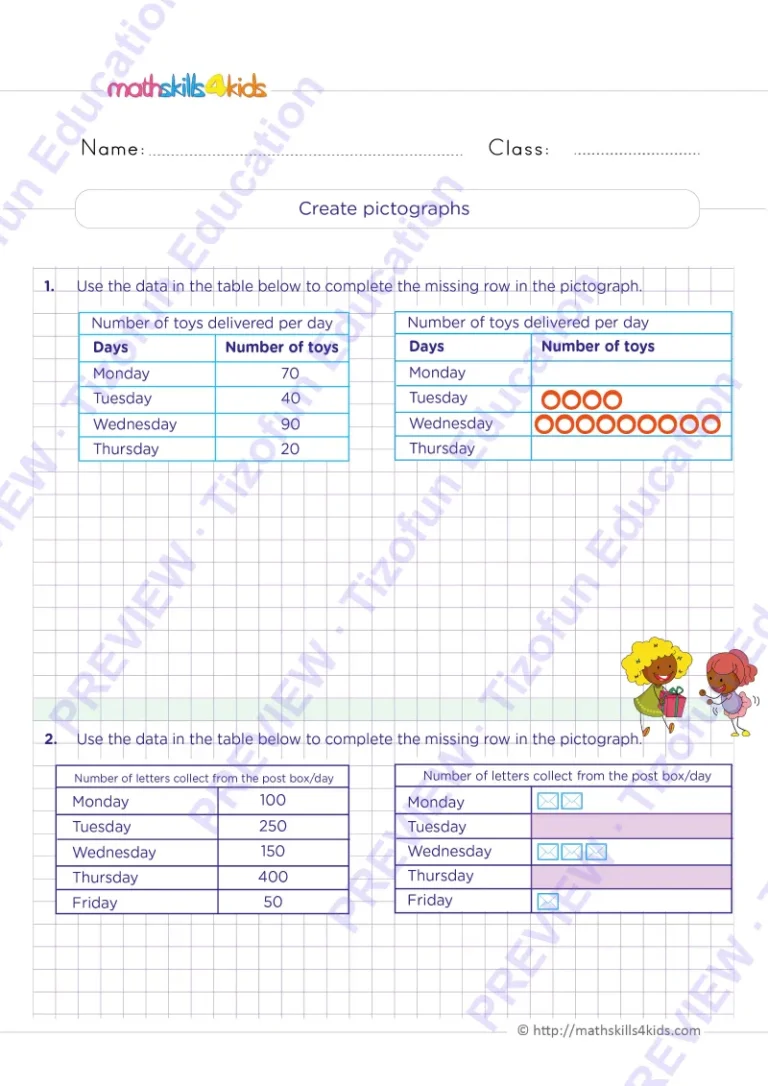
- Pictographs and line plots: interpret and create, line plots with fractions.
- Frequency tables.
- Bar graphs and double bar graphs: interpret and create.
- Histograms: interpret and create.
- Line graphs and double line graphs: interpret and create; circle graphs: interpret.
- Stem-and-leaf plots (interpret and create), box-and-whisker plots (interpret).
- Choose the best type of graph.
- Answer key: every worksheet corrected.
Learning goals (Common Core 6.SP.B.4 · KS3 Statistics)
- Organise data in a frequency table.
- Read, draw and compare graphs of several kinds.
- Choose a suitable graph for a data set.
In class or at home: pair it with a class survey so that children graph their own data.
Previews
Product details
| Subject | Mathematics |
|---|---|
| Level | Cycle 3 (ages 9–11) |
| Last updated | 30 September 2026 |
| Seller | Tizofun Education |