Weather and Climate
Sunny, rainy, windy… How do scientists measure the weather? And how do they know what weather to expect next season? Let’s measure the weather, read weather data, and tell the weather from the climate.
This lesson takes about 10 minutes. You can take a break after each part.
Before you start
Learning objectives
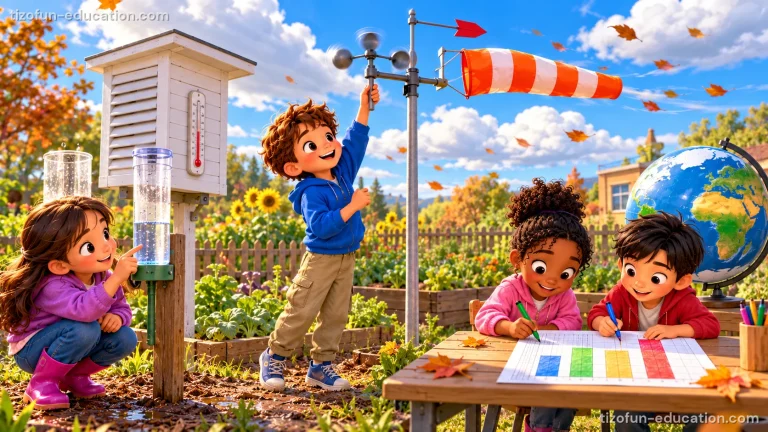
- I can name the tools that measure temperature, rain and wind.
- I can use tables and bar graphs of weather data to tell the usual weather of a season.
- I can tell the weather from the climate, and describe climates of different regions of the world.
Measuring the weather
Tools that measure
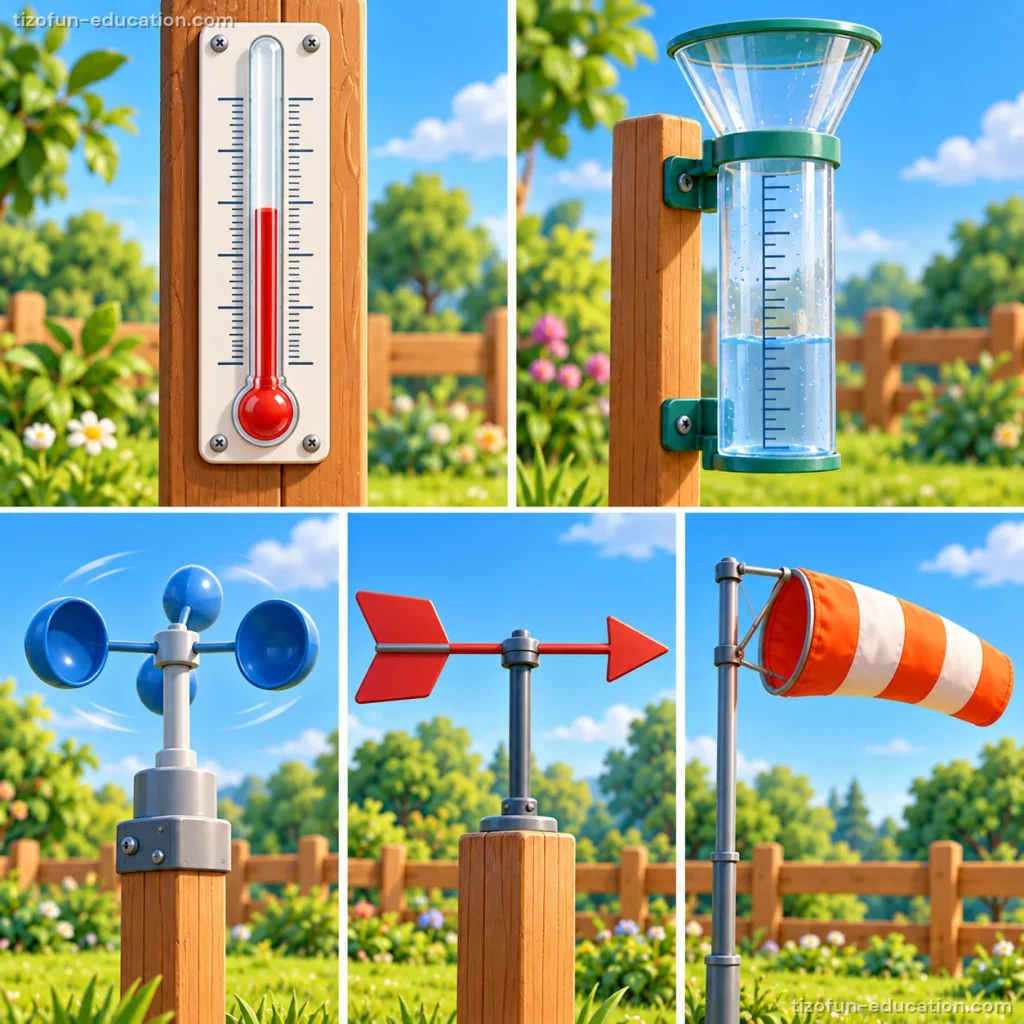
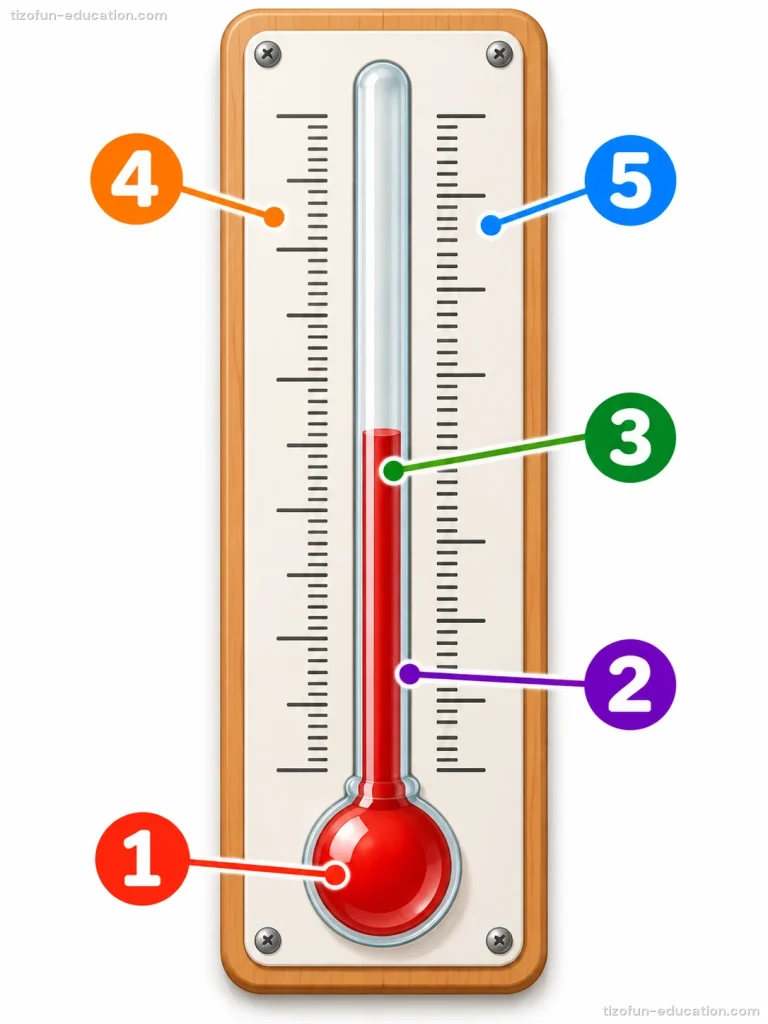
Scientists measure the weather with tools. A thermometer measures the temperature: how hot or cold the air is, in degrees.
A rain gauge collects rain to measure how much has fallen. An anemometer measures how fast the wind blows, and a wind vane shows where it comes from.
Loading the questions…
Weather through the seasons
Tables and bar graphs
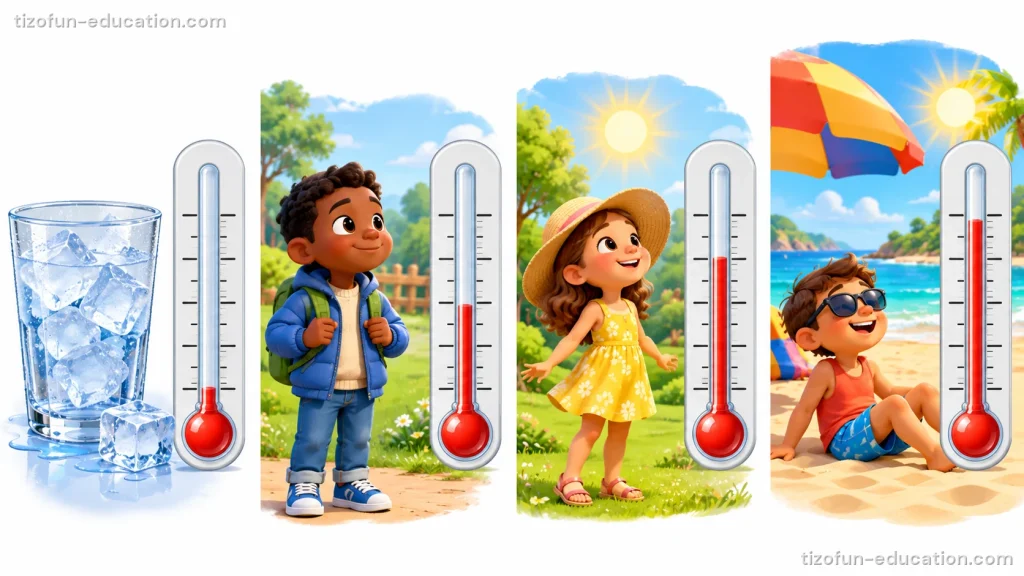
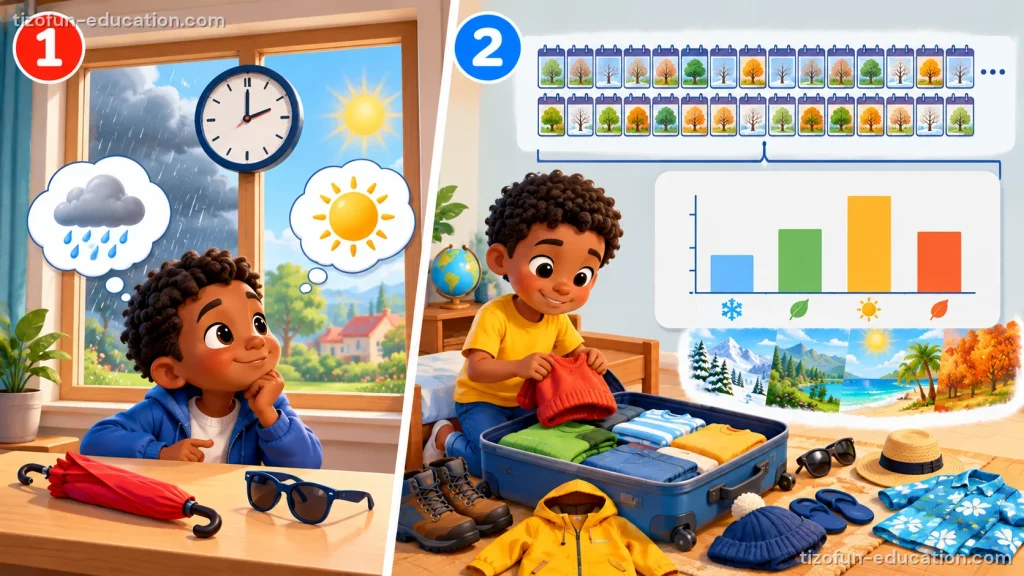
Every day at noon, a class writes the temperature in a table. Later, they draw a bar graph.
The data show patterns: in many places, summer is warm and winter is cold. So we can tell the usual weather of each season.
Loading the questions…
Weather or climate?
Today, or many years
The weather is what it is like outside right now: it can change from one hour to the next. The climate is the usual weather of a place, measured over many years.
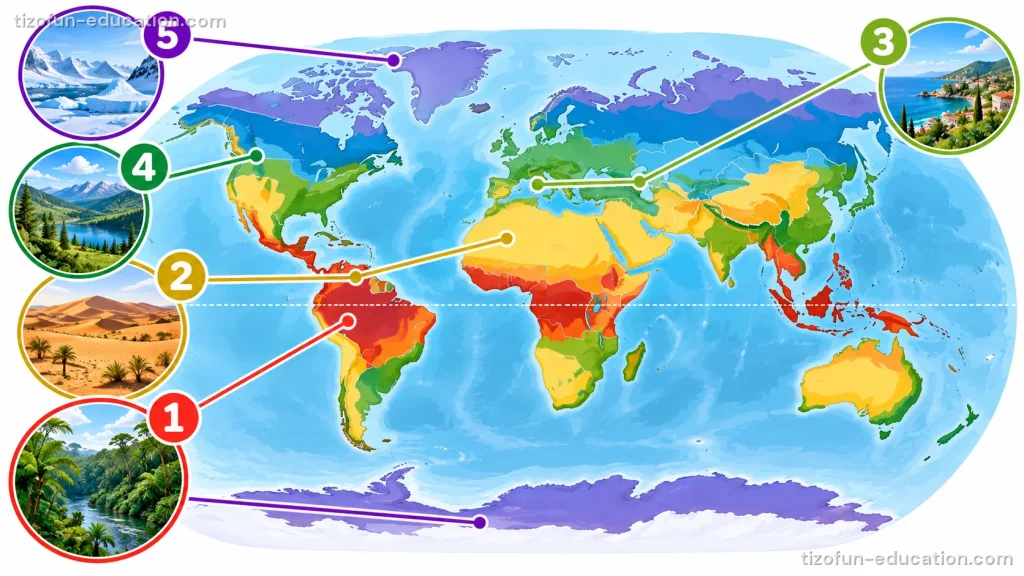
Near the equator, it is hot and rainy all year; in deserts, it is very dry; near the poles, it is cold all year.
Loading the questions…
Review game
Final assessment
To master the lesson, you need at least 60% correct answers.
Loading the assessment…
Summary
- Scientists measure the weather with tools: thermometer (temperature), rain gauge (rain), anemometer (wind speed), wind vane (wind direction).
- Weather data written in tables and bar graphs show patterns: the usual weather of each season.
- The weather is what it is like today; the climate is the usual weather of a place over many years.
- Regions of the world have different climates: hot and rainy near the equator, very dry in deserts, cold near the poles.
A few related activities
 LessonMagnets: Pull, Push and What They AttractA note held on the fridge, a cabinet door that clicks shut, a machine that sorts cans: magnets…See the activity
 LessonFossils and Earth’s PastA sea shell on top of a mountain? A footprint in a rock? Fossils are clues left by…See the activity
 LessonForces and Motion: Balance, Patterns and GravityA tug-of-war rope that does not move, a swing that goes back and forth, an apple that falls…See the activity
