2nd Grade Line Plot Worksheet: Read the X Marks, Answer Six Questions
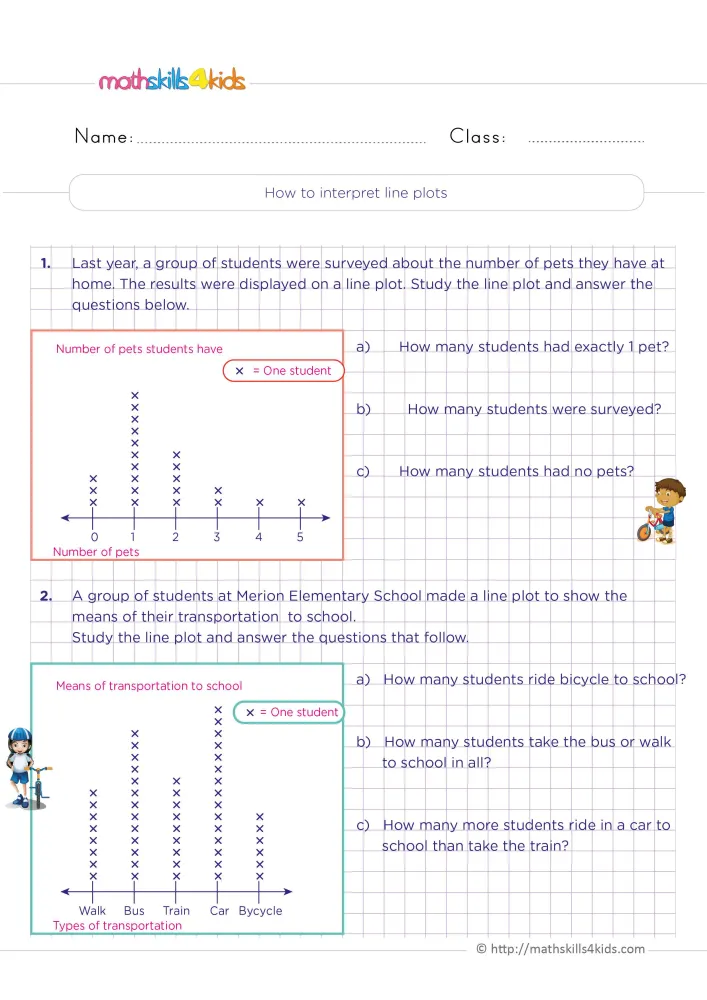
Ask a class of seven-year-olds who has a pet and every hand goes up with a story. This 2nd grade line plot worksheet turns those stories into numbers. The first plot shows a survey about the number of pets students have, from 0 to 5. Each X stands for one student, stacked above the right number. The second plot shows how students at a school get there: walk, bus, train, car or bicycle. Your child counts the stacks to answer three questions for each plot, such as how many students had exactly one pet. A second page gives the answer key.
Why a stack of X marks is a picture of data
A line plot is a number line with data piled on top. The X marks each stand for one person, so the tallest stack is the most common answer, and children can see the result before they count a thing.
The page asks three kinds of questions: some read one stack, such as the students with no pets, while others add stacks, like the bus and the walkers together. Finally, one asks how many more students come by car than by train, which is a comparison.
That mix matters because real data questions rarely stop at one stack. So the plot also trains addition and subtraction, quietly.
At the table: the tall stacks
Start with question 1c. Ask, "Which stack is above the zero? How many X marks?" It is a short count and a good warm-up.
Question 1b asks how many students were surveyed, and many children answer with the tallest stack only. Instead of correcting, ask, "Did only those students answer, or everyone?" Then add the stacks one by one.
In the second plot, the car stack is long and easy to miscount. Suggest, "Touch each X with your pencil and say the number." For example, a light tick next to every fifth mark keeps the count safe. Also, writing the total under each stack before answering helps with question 2c.
A family survey on the fridge
Line plots are easy to make at home. Ask family and friends how many brothers and sisters they have, draw a short number line, and let your child add one X for each answer until the tallest stack shows the winner.
After a game of Hopscotch, record how many squares each player reached and plot the results.
Also, plotting the number of books read each day for a week turns reading time into data your child can see.
Once you finish the page, check it with the answer key together and praise the counting: "You touched every X before you wrote. That kept it accurate."
About this 2nd grade line plot worksheet and its answer key in full
Download the worksheet: 2nd Grade Line Plot Worksheet: Read the X Marks, Answer Six Questions
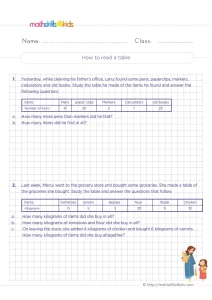 Worksheet3rd Grade Reading a Data Table Worksheet: 2 Tables
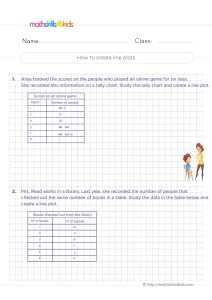 Worksheet3rd Grade Making Line Plots from Data Worksheet: Scores and Books
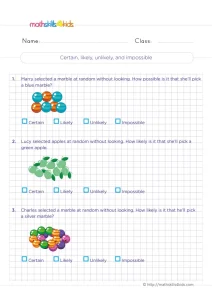 Worksheet3rd Grade Likely and Unlikely Events Worksheet: Marbles and Apples
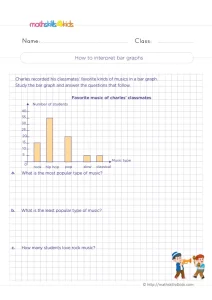 Worksheet3rd Grade Interpreting Bar Graphs Worksheet: Favorite Music
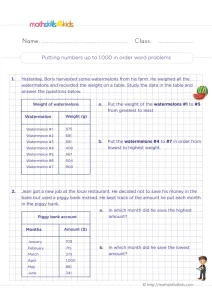 Worksheet2nd Grade 3-Digit Data Tables Worksheet: Watermelons and a Piggy Bank
A few related activities
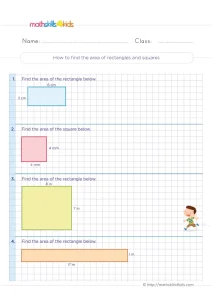 Three rectangles and one square, each with its side lengths. Your child multiplies length by width to find…See the activity3rd Grade Naming Solid Figures Worksheet: Prisms, Pyramids and More
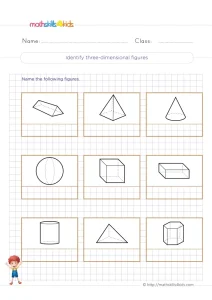 Nine drawn solids to name, from a cube and a cone to a hexagonal prism and a triangular…See the activity3rd Grade Multiplication Worksheet: Find Products Using Properties
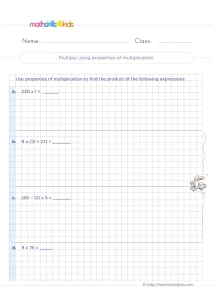 Work out four products, from 230 x 1 to 9 x 75, with the identity, distributive and commutative…See the activity
