3rd Grade Making Line Plots from Data Worksheet: Scores and Books
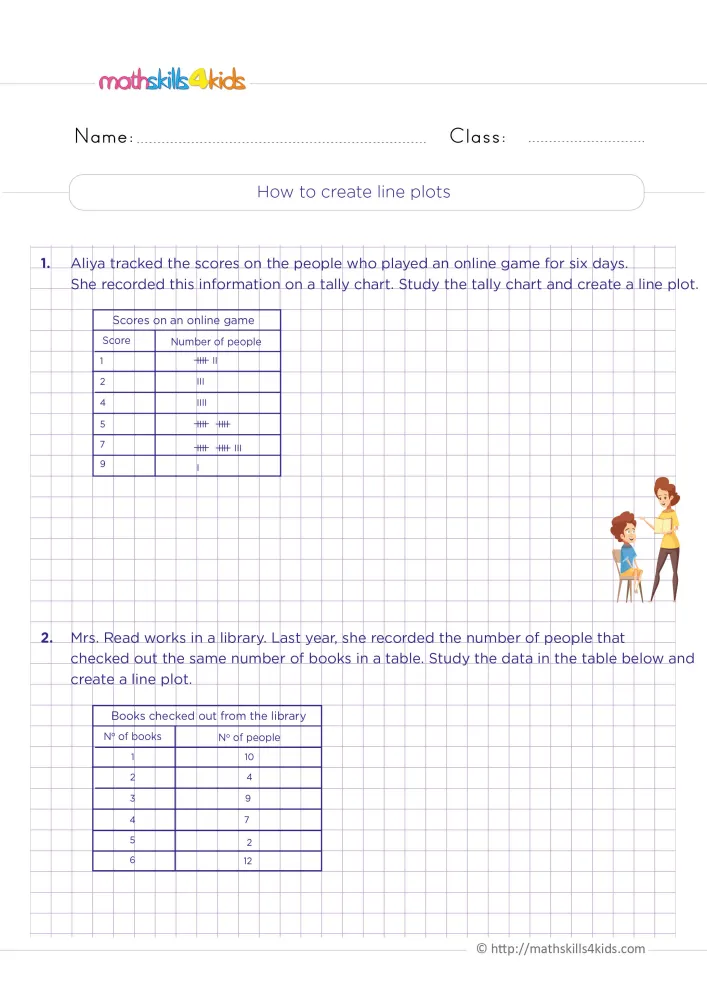
A line plot shows data with X marks stacked above a number line. This 3rd grade making line plots from data worksheet has two items, numbered 1 and 2, on grid paper. In item 1, Aliya tracked the scores of people who played an online game. Her tally chart lists the scores 1, 2, 4, 5, 7 and 9, with a group of tally marks next to each one. In item 2, Mrs. Read counted how many books people checked out from the library. This time, the data sits in a frequency table, from 1 to 6 books. Your child draws one line plot for each item, so there are two plots to build. A mother and her son read together beside item 1. Page two shows both line plots, with a key that says one X is one person.
Counting the X marks
In item 1, the tally marks give 7, 3, 4, 10, 13 and 1 people for the scores 1, 2, 4, 5, 7 and 9. So the tallest stack is above 7, with 13 X marks. In item 2, the table gives 10, 4, 9, 7, 2 and 12 people for 1 to 6 books. All the X counts in the key are right.
The scores 3, 6 and 8 have no X at all, but they still need a place on the number line. This matters, because a line plot keeps equal steps between numbers, even when some of them have no data at all. Line plots are taught in third grade, so this page fits well.
At the table: number line first
Ask your child to draw the number line first, with equal gaps from 1 to 9. Then they count the tally marks in groups of five and write the total next to each row. After that, they draw the X marks in neat columns, one above the other. Small, even X marks make the stacks easy to compare.
The text has a few slips. Item 1 says "the scores on the people", but "the scores of the people" is right. On page two, "Placed seven x's" should read "Place seven x's". The key also writes "7 people scored 1 score", and the table uses "N° of books" instead of "Number of books".
After the page: a plot of your family
Ask everyone at home how many pets, books or cousins they have. Then draw a number line, and add one X for each answer. Next, ask your child which number has the most X marks. Finally, check both line plots with the answer key on page two.
About this making line plots from data page and its two-page answer key
Download the worksheet: 3rd Grade Making Line Plots from Data Worksheet: Scores and Books
 Worksheet3rd Grade Reading a Data Table Worksheet: 2 Tables
 Worksheet3rd Grade Likely and Unlikely Events Worksheet: Marbles and Apples
 Worksheet3rd Grade Interpreting Bar Graphs Worksheet: Favorite Music
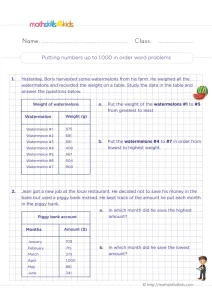 Worksheet2nd Grade 3-Digit Data Tables Worksheet: Watermelons and a Piggy Bank
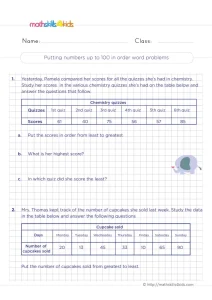 Worksheet2nd Grade Ordering Data to 100 Worksheet: Quiz Scores and Cupcake Sales
A few related activities
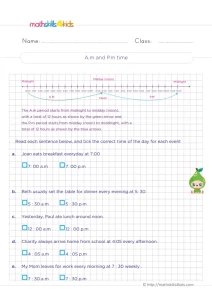 Five everyday events, from breakfast to dinner. Your child reads each time and ticks a.m. or p.m. using…See the activity3rd Grade Divide by 2 Worksheet: Long Division with Even Numbers
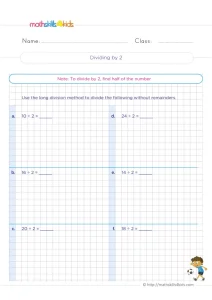 Six even numbers from 10 to 24 to divide by 2 with the long division method. Each answer…See the activity3rd Grade How Much Money in All Worksheet: 3 Word Problems
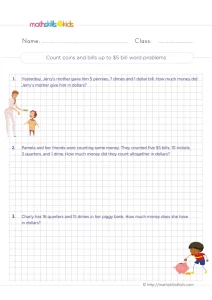 Three money word problems with pennies, nickels, dimes, quarters and $1 and $5 bills. Children find each total…See the activity
