1st Grade Animal Picture Graph Worksheet: One X for Each Animal
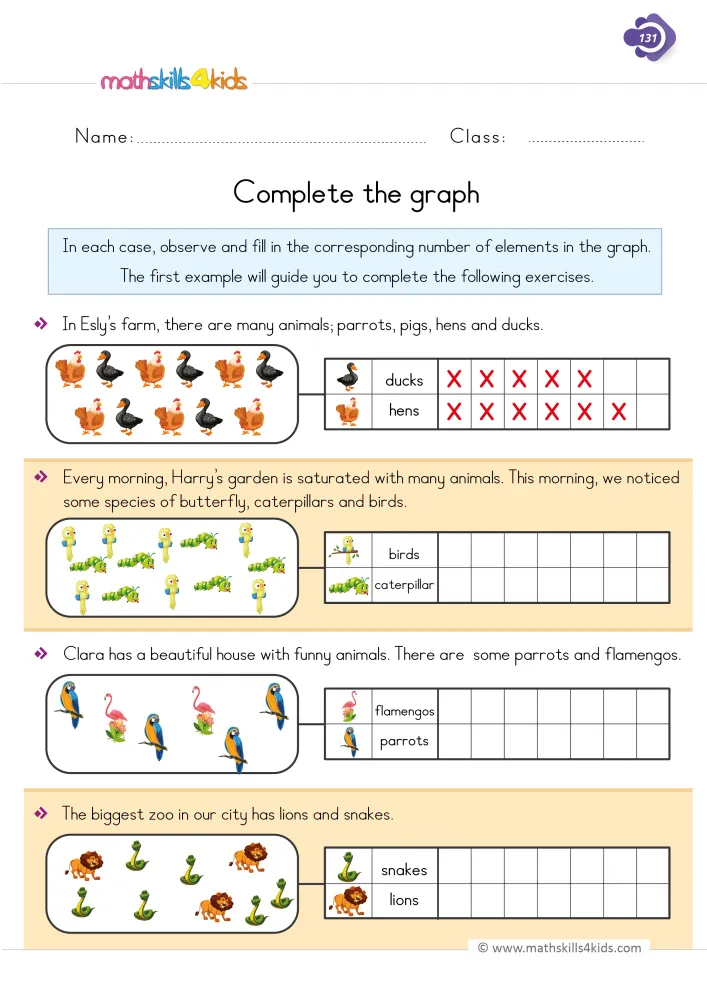
Show a six-year-old the farm scene at the top and they will often count the hens and the ducks all together, then wonder where the number goes. This 1st grade animal picture graph worksheet sorts that pile into rows. Each scene sits next to a small graph with two rows of seven boxes, one row per animal. The first scene is a worked example: five ducks, six hens and one X for each. Then your child does the same with birds and caterpillars, flamingos and parrots, and finally lions and snakes. Because the rows line up, the longer row shows the bigger group at a glance. A second page gives the answer key.
Why one mark for one animal matters
A picture graph rests on a quiet promise: one X for each animal, no more and no less. That is one-to-one correspondence again, now used to record data instead of only counting it.
Once the marks are down, the graph does something a single number cannot. Two rows side by side show which group is bigger, without any counting at all. So the page also builds the habit of reading data from left to right.
Look at the worked example. The hens row runs one box past the ducks row, so your child can see that there are more hens before saying a number. That visual comparison is the seed of every bar graph to come. Small, but real.
At the table: the garden and the zoo
Start with the example. Ask, "How many ducks? Point to each X." Your child will see that the marks match the pictures.
The garden scene is the tricky one. The yellow birds and the green caterpillars are mixed together, so a child may count the same bird twice or skip one. Instead of correcting, try a light pencil dot on each animal as its X goes in. For example, dot a bird, then make one X in the birds row.
The zoo scene hides a different trap. The snakes are small and scattered between the lions, so a row can end up one short. Then let your child touch each snake again and find the gap alone.
Finally, once both rows are full, ask, "Which row is longer?"
Graphs that start at the snack table
Graphs make the most sense when the data comes from home. At snack time, line up apples and bananas in two rows and ask which row is longer. Also, after a walk, tap the table once for each bird or dog you saw, then draw one X for each on a scrap of paper.
The card game Memory works well here too. While you play, keep a small graph of the pairs each player finds, one mark per pair, and compare the rows at the end.
Moments like these show that a graph is careful counting, put in order. When the page is done, check it with the answer key together and name the effort: "You made one X for every animal. That is careful work."
About this 1st grade animal picture graph worksheet and its answer key
Download the worksheet: 1st Grade Animal Picture Graph Worksheet: One X for Each Animal
 Worksheet3rd Grade Reading a Data Table Worksheet: 2 Tables
 Worksheet3rd Grade Making Line Plots from Data Worksheet: Scores and Books
 Worksheet3rd Grade Likely and Unlikely Events Worksheet: Marbles and Apples
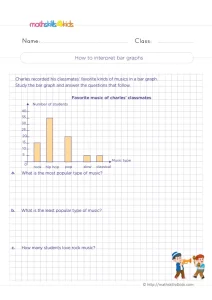 Worksheet3rd Grade Interpreting Bar Graphs Worksheet: Favorite Music
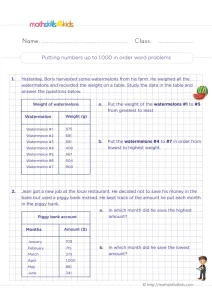 Worksheet2nd Grade 3-Digit Data Tables Worksheet: Watermelons and a Piggy Bank
A few related activities
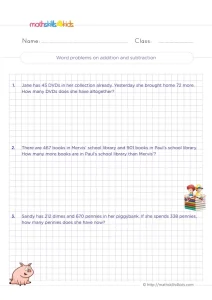 Three word problems about DVDs, school library books and pennies in a piggy bank. Your child adds or…See the activity3rd Grade 8 Times Table Worksheet: 12 Column Facts and a Doubling Trick
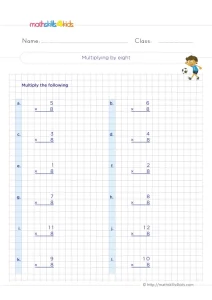 Twelve column facts times 8, from 1 × 8 to 12 × 8, in a mixed order. Double…See the activity3rd Grade Multiplication Properties Worksheet: Zero, Identity, Commutative
 Tick the right property for four equations, from 1,978 x 0 = 0 to (60 x 1) =…See the activity
